


Your network of stores working as a single team

Features

Industries

About us

Resources
INDUSTRIES

Retail
Launch campaigns, assign and monitor tasks at each point of sale, in real time.

Restaurants
Communicate with, train, and supervise your front-of-house and kitchen staff.
Hotels & Tourism
All departments are on the same page, from the front desk to housekeeping.

Fashion & Luxury
Promote the brand and run campaigns in each store.

Pharmacy & Health
Protocols, regulatory training, and communication at each facility.

Manufacturing
Instructions, tasks, and on-the-job training, without a computer.
October 8, 2026

CONTENT CREATED BY:
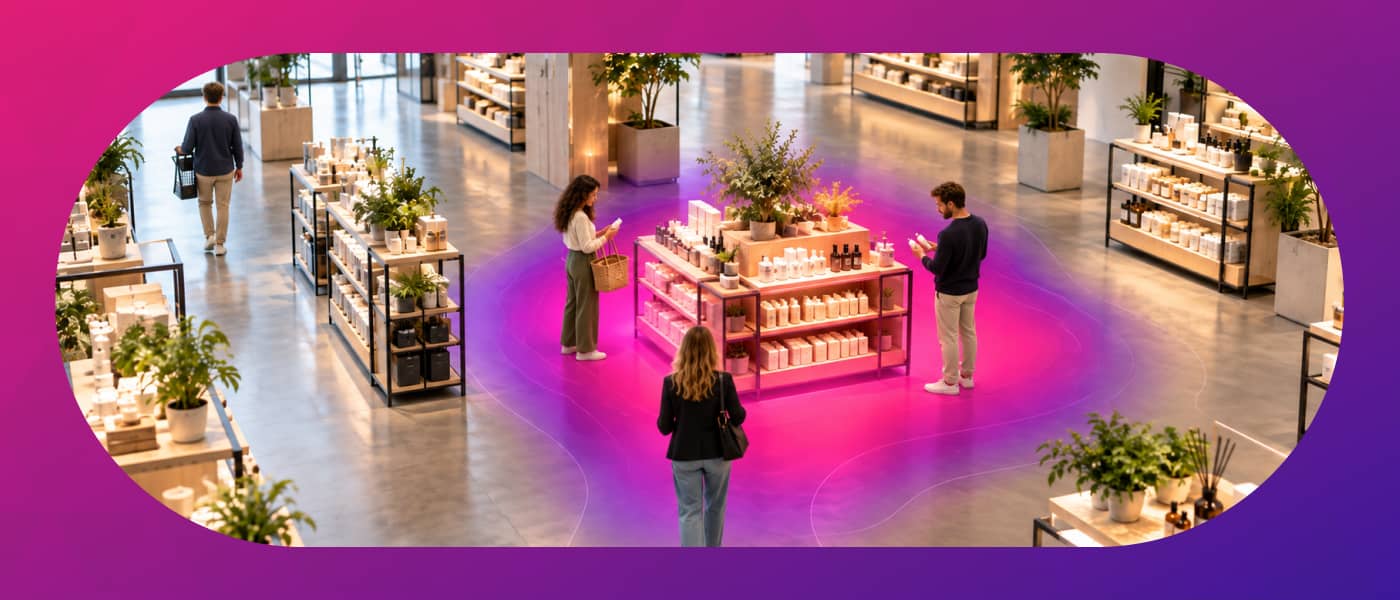
Table of contents
A hot spot in merchandising is an area of the store with high customer traffic, high visibility and a greater likelihood of generating a purchase. These are the areas where the natural flow of circulation concentrates: the entrance, the main aisles, the areas near the checkout or the spaces around high-draw products. In these positions, displaying a product considerably increases its chances of being seen, touched and bought.
In the context of retail and store management, correctly identifying and making the most of hot spots is one of the most direct levers for increasing sales without expanding floor space or investing more in communication. One of the main goals of visual merchandising and planogram strategy is to get the maximum return out of these high-value zones.
Identifying hot spots requires observing and measuring where customer traffic actually concentrates, not where it is assumed to be. There are several complementary methods:
The most basic technique consists of recording customers’ routes and the areas where they stop over a representative period. It makes it possible to detect circulation patterns and frequent stopping areas with no investment in technology.
Video surveillance with motion analytics, presence sensors and LiDAR technology make it possible to generate automatic heat maps that visualize traffic intensity by zone. Some systems work without capturing images, in line with data protection regulations.
Cross-referencing POS (point of sale) data with the layout of shelving by zone makes it possible to calculate the real profitability per square foot and detect which areas generate sales and which do not.
| Type of zone | Characteristics | Typical example |
|---|---|---|
| Hot zone | High traffic, high visibility, greater likelihood of purchase | Entrance, checkout, gondola end caps |
| Warm zone | Moderate traffic, medium visibility, planned purchases | Secondary aisles, brand areas |
| Cold zone | Low traffic, low visibility, poor performance by default | Back corners, aisle ends |
Identifying the hot spot is the first step. The second, and most important one, is deciding what to place in it and how to display it to maximize its impact. These are the most effective strategies:
A hot spot cannot be understood in isolation: it is one piece of the broader system of visual merchandising. Managing physical space, the planogram, the layout of shelving and visual communication are the tools that turn a high-traffic area into a sales engine. Without a coherent visual merchandising strategy, a hot spot can be underused even when it holds the right product.
If you want to go deeper into how visual merchandising organizes the shopping experience from the entrance to the checkout, we recommend this resource: What visual merchandising is and how it impacts sales.
The concept of the hot spot is not exclusive to brick-and-mortar retail. In e-commerce and the online store, there is a direct equivalent: the areas with high visibility and the highest interaction rates. Web heat maps (tools such as Hotjar or Microsoft Clarity) show where users click, how far they scroll and which elements capture their attention.
In an omnichannel strategy, this dual reading is especially valuable: a product that does not perform on the physical shelf but does generate digital traffic (or the other way around) is a clear signal of how to adjust its exposure in each channel. Artificial intelligence is accelerating this ability to cross-reference data between the physical and digital worlds. Find out how AI is transforming merchandising.
Your network of stores working as a single team
Unified operations, instant communication, and real-time performance data


Hot spots are not static. Traffic patterns change with the time of year, with layout changes, with new openings or store remodels. That is why managing them requires continuous measurement and periodic auditing.
A complete retail audit includes reviewing hot spot performance: whether the products placed in them are delivering the expected return, whether the signage is in good condition and whether the category on display is still the most suitable one for that area.
The most relevant retail KPIs for measuring hot spot performance include: sales per square foot, product turnover by zone, conversion rate by area and the traffic-to-sales ratio.
Identifying the hot spot and defining the strategy is only half the job. The other half is making sure in-store teams correctly execute the guidelines for display, product rotation and signage. This is where many chains lose effectiveness: the strategy exists at headquarters, but it does not reach the frontline workers who have to implement it day after day with enough clarity.
Task management platforms for retail allow area managers and head office to send precise instructions on how to prepare each hot spot: which product to place, in which position, with what communication, and to verify that it has been executed correctly through photo evidence and digital checklists.
If you manage store networks in the retail sector, discover how isEazy Engage helps connect merchandising strategy with your teams’ daily operations.
Managing hot spots efficiently is directly linked to the organization’s ability to coordinate in-store operations quickly and consistently. The more locations a chain has, the bigger the challenge of guaranteeing that planogram and display decisions are executed uniformly. Discover the keys to efficient store management and how technology helps you scale it.
Optimizing hot spots is not just about choosing which products to place in the highest-traffic areas. The real challenge is making sure the strategy defined at headquarters is executed correctly and consistently across every point of sale.
With isEazy Engage, retail chains can connect that strategy with their teams’ daily operations: centralizing task management, speeding up employee communication and making it easier to deliver frontline team training from a single app.
This way, every change in display, promotion or campaign can reach stores with clear instructions and simpler follow-up, helping to maintain consistent execution across the whole network and to get more out of the spaces with the greatest commercial potential.
A hot spot is an area of high footfall and visibility inside the store, where customers stop frequently and purchase potential is high. A cold spot, on the other hand, is an area with little traffic and low visibility, usually back corners, dead-end aisles or poorly lit areas. The key difference is not fixed: a cold spot can become a hot one with the right combination of signage, lighting, draw products and visual animation.
Hot spots are measured by combining several techniques. The most traditional one is manual traffic counting by zone, which consists of recording how many customers pass through or stop in each area of the store. Current technology solutions make it possible to do this automatically: computer vision cameras and motion sensors generate visual heat maps showing traffic intensity by zone. Sales per square foot (shelf performance), POS analysis by section and, in omnichannel environments, web analytics tools that apply the same concept to user behavior in the online store are also used.
Hot spots hold the products the store most wants customers to see and buy. There are two main criteria. The first is profitability: products with a higher commercial margin, or seasonal and promotional items the store needs to move quickly. The second is the visibility of key references: leading brands, new products or items that generate traffic on their own and can pull cross-sales toward complementary references. The combination of both criteria — high turnover and high margin — is what defines the optimal selection for each hot spot.
Technology has turned the identification of hot spots from a manual process into one based on continuous data. Video analytics systems with artificial intelligence process customer movement in real time and generate dynamic heat maps that update without manual intervention. LiDAR and presence sensors allow the same tracking without capturing images of people, which resolves privacy restrictions. Some retailers combine this data with POS information to cross-reference high-traffic zones with high-conversion zones, detecting hot spots that generate visits but not sales — a sign of a display or pricing problem that traditional methods could not identify.

Ensure your network is aligned through a single, traceable channel.
Request a demoContact us
Your stores, all in a row. Your team, unstoppable
Operations, communication, and training all in one AI-powered app. For teams without desktops


